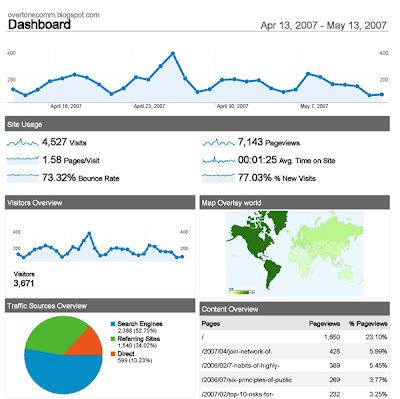
Google Analytics has been my stats package of choice for some time now for both this blog and those of my clients since its launch in 2005. It got a slow start because it couldn’t handle the influx of demand at first, but now it is available to anyone.
Best of all, the package is free. Of course, their interest is getting you to apply Adwords to your page, but you don’t have to do that, and if you do, this tool makes it easy to track the campaigns.
It tracks in-depth information that I like to use for measurement, including referrals; traffic information (unique users, visits and pageviews); key words; top content; as well as a lot of information about users location, network and browser type. My only gripe had been that I couldn’t get the pretty charts it generated without taking screen shots. All I could get was XML, Excel and text files.
However, over the weekend, my “go-to” tool got even better. Last week Google Analytics announced an exciting new reporting interface which was released over the weekend. They have put out a great list showing the features and also a flash overview of the new interface.
I love the new interface because it allows you to export the data in many more formats than before, such as the ability to send reports via e-mail, export into PDF, and to drill down in the geo-map to a certain location. Analytics already supported exporting to Excel, XML and text. It also allows you to set up regular e-mail reports, to say, a client, or to yourself. I really like the idea this functionality and hope it works as advertised.
The new Google Analytics allows you to customize your dashboard, which is a feature I am very interested in exploiting, and then download all of the data into a PDF file. This is already going to help me this week as I report on the initial results of the SeaWorld campaign in a measurement seminar I am speaking at with Katie Paine for the PRSA Travel and Tourism group, which is meeting in Los Angeles next week.
